

A co-created newsletter of resources and actions for climate biotech
It was a phrase used on two globes from the 1500s to signify unexplored or potentially dangerous territories, a common practice in an era when the air contained 280 ppm CO2. By 1960, when CO2 levels had risen to 315 ppm, NASA’s Nimbus program was providing detailed satellite maps of the Earth’s weather patterns and surface, replacing fantastical creatures with real images of our planet.
Fast forward to 2024, with CO2 levels at 420 ppm, and we can layer various types of data onto these maps, from chlorophyll concentration and power costs to changing snowpacks and energy pipelines. Ever wonder where the 120,000 abandoned wells leaking methane are in the US, or wished you could see everywhere humans have made an impact on the planet? We’ve got 15 maps for you to start with.
Also in this month’s issue:
- Open job listings and funding opportunities in climate biotech
- Upcoming events happening from the US, the UK, and online
- In case you missed it, here’s a recording of our event last month with Work on Climate about how to get started in Climate Biotech!
- Inspiration for your next vibrant, easy-to-make, just-for-fun science project
And finally, we want to continue making this newsletter with you and your needs as a member of the climate biotech community in mind — would you please fill out this 4-question survey to help us understand your needs?
With love and action-oriented optimism (and dragons),
The Homeworld Team
15 Maps for Climate Biotech

ENERGY. What does it cost to power the U.S.? The Levelized Cost of Energy (LCOE) map shows levelized costs of electricity across the country along with the cheapest technologies in each area. (h/t Monica Cesinger)
GHG EMISSIONS. With powerful data visualization, Climate Trace tracks and shares detailed greenhouse gas emissions using satellites and remote sensing data.
MOUNTAIN SNOWPACK. In the western U.S. — a key player in the region’s water cycle — is on the decline. This EPA indicator measures trends in the amount of snowpack and its timing over the past several years.
HUMAN FOOTPRINT. The Socioeconomic Data and Applications Center hosts maps of the human footprint across the world. (h/t Monica Cesinger)
VEGETATION. This interactive map by NASA’s Earth Observatory shows chlorophyll and vegetation across the world between 2002 and 2023.
GEOENGINEERING. Here’s a robust map of geoengineering research sites around the world. It’s anti-geoengineering, but does a great job of keeping track of it! (h/t Daniel N)
CARBON CAPTURE. This interactive map catalogs carbon capture and storage projects around the world.
LAND PROTECTION. By 2030, the Biden administration aims to conserve, restore, or protect 30% of U.S. territory. The Atlas Interactive map shows ongoing projects in those realms, tracking progress made toward that goal.
CLIMATE TYPES. An updated world map of the Köppen-Geiger classification details different climate types on the globe in the second half of the 20th century.
MATERIAL FLOW. The Material Flow Analysis Portal visualizes UN data on historical global materials extraction and flow. (h/t Monica Cesinger)
ENVIRONMENTAL JUSTICE. The Global Atlas of Environmental Justice strives to document and catalog social conflicts around environmental issues.
PIPELINES. The National Energy and Petrochemical Map shows many items of interest, including the extensive network of natural gas pipelines in the US. (The Methodology notes say their database has 214,548 orphaned wells in the US).
OIL WELLS. This storymap made by the Orphaned Wells Program Office documents efforts to plug oil wells across the U.S.
RISING TEMPERATURES. The National Climate Assessment Interactive Atlas Explorer can display a wide variety of data, including the change in the number of days below 32˚F across the US.
OUR PLACE IN THE UNIVERSE. This is the most detailed map yet.
Jobs, Funding, & Opportunities
Funding ($ looking for projects)
- The second round of Exploratory Grants for Atmospheric Methane Research is currently open — apply by June 2. (h/t Erika Reinhardt)
- Advanced Research and + Invention Agency (ARIA) has an open opportunity for seed funding focused on climate monitoring and measurement with awards up to £500k. 3-page proposal with applications due June 18. (h/t Diane Matar)
- ARPA-E’s Vision OPEN invites the research community to develop new technology aligned with three specific goals — learn more about them here. (h/t Chris Eiben)
Opportunities
- Looking for an opportunity to improve your writing skills? Apply for the 2024 Roots of Progress Blog-Building Intensive by June 7.
- Frontier’s pre purchase cycle is open — apply to be a Frontier supplier.
- Thinking about marine carbon dioxide removal? Help the Ocean Visions team understand your biggest challenges to help direct community efforts where they’re most needed!
Job postings
- Product Manager, Ark Biotech
- Program Director, Methane Removal, Spark Climate Solutions
- Strategic Communications Lead, Spark Climate Solutions
- Research Intern (Bioprocessing), Centeon (h/t Jerome Unidad)
- Part-time Climate & Energy Fellows, Science for America (h/t Zara Burke)
- Sr. Process Engineer, Bluestem Biosciences (h/t Billy Hagstrom)
- Analytical Chemist, Elysia Creative Biology (h/t Eli Hornstein)
- Genetic Engineer, Elysia Creative Biology (h/t Eli Hornstein)
- Plant Scientist, Elysia Creative Biology (h/t Eli Hornstein)
- Scientist in Protein & Biopolymer Chemistry, Tezza Foods
- Microbiologist, MicroHarvest
- Check out the Climate Biotech Jobs Board for even more job postings!
Research & News
Technical resources
- Want to know more about soil across the U.S.? Check out the USDA Soil Survey. (h/t Pritha Ghosh)
- The DOE released their Greenhouse gasses, Regulated Emissions, and Energy use in Technologies (GREET) life cycle analysis model for the 40B Sustainable Aviation Fuel credit. (h/t Nazish Jeffery)
- This report from Carbon Direct and Meta features CDR methods that could also accomplish ecological restoration.
- The EPA, USDA, and FDA’s joint regulatory plan for biotech (h/t Nazish Jeffery)
- AlphaFold 3 improves ability to predict structures and interactions of life’s molecules. (h/t Nick Barry)
- Computation resource: a paper-scraping Python package.
Innovations and Developments
- Global forestry plays a key role in CDR — MOMBAK is working to build the carbon removal industry, starting with reforestation work in the Amazon.
- Tom Kalil is launching a new firm, Renaissance Philanthropy, to connect high-net worth individuals to impactful projects.
- Metalplant is a new venture using farmland with the primary goal of carbon sequestration. Learn more about their unique approach in this podcast. (h/t George Tong)
- Elman is an LLM co-pilot designed to enhance the quality, speed, and impact of scientific R&D. Read about the team’s learnings from building agentic workflows here.
- Circe Bioscience licenses a new gas fermentation approach that enables engineered microbes to consume greenhouse gasses and produce materials for future use across industries.
- This CDR approach involves ocean iron fertilization using an electrochemical method that allows greater control over iron release.
- This paper explores what open-endedness — as opposed to purely goal-oriented design — in synthetic biology could look like. (h/t Monica Cesinger)
- A team is working on biocomposite thermoplastic polyurethanes containing evolved bacterial spores as living fillers to help facilitate polymer disintegration. (h/t David Kim)
- New in preprints: A team is working to develop a genetically-encoded system to quantify and evolve RuBisCO-catalyzed carbon fixation. (h/t Derin Fasipe)
- Data sonification reveals that hydrogen bonding heterogeneity correlates with protein folding transition state passage time. (h/t Derin Fasipe)
- Google, Meta, Microsoft, and Salesforce announce the Symbiosis Coalition, which “seeks to identify and scale next-generation nature restoration projects with a focus on certainty of climate impact.”
Climate Impact Studies
- A review of biological weathering and its consequences, from a nano- to global- scale
- A look at possibilities for the “refinery of the future” (h/t Monica Cesinger)
- The effects of corporate investment and public grants on climate and energy startup outcomes (h/t Monica Cesinger)
- Theoretical analysis of natural gas recovery from marginal wells with a deep well reactor (h/t Derin Fasipe)
- The Global Critical Minerals Outlook 2024 offers insights into the supply and demand of key energy transition minerals like lithium, copper, cobalt, graphite, and rare earth elements. (h/t Monica Cesinger)
Blog Posts & Podcasts
“Biology has become increasingly overwhelming for someone looking to get in. It often feels as if you have to study a specific question for your whole life to make a meaningful impact. But even though things have gotten complicated, we should still make room for romance. We are entering an entirely new era of biology. Throughout history, we have often been explorers in biology, rather than inventors. Now, we are at the cusp of biological innovation where we are starting to build with biology rather than just exploring the maps that exist.”
— “Biology Deserves Our Wonder” by Dan Voicu, Ideas Matter Fellow
“Biotech is ideally suited to solving planetary-scale challenges because of its two extremes: It is atomically precise and infinitely scalable. But there are several reasons that biology is not yet harnessed fully to address climate change.”
— “We wanted solarpunk, instead we got monoclonal antibodies” by Dan Goodwin
“Jim Simons and I hang outside with a Parliament then he asks me if he could borrow some cash. He doesn’t carry cash and needs to tip his driver. So we go to the back of a nearby dive bar and I pull out cash from an ATM by the bathrooms. Which, all context considered, is absolutely hilarious: In my head I was sweating that there wasn’t enough cash in my account for his driver. But we were just two dudes ranting about the hands we could have won.”
— A story about Jim Simons from Dan Goodwin
Upcoming Events
- Applied, Vol. 5: Connections across the environmental and life science sector // 6/4, New York (h/t Justin Morris-Marano)
- European Congress on Biotechnology // 6/30–7/3, Rotterdam, Netherlands
- Gordon Research Conference on Biomineralization // 8/4–8/9, New London, New Hampshire
- Geochemistry conference with a focus on ERW // 8/18–8/23, Remote + Chicago, Illinois
Inspiration – Motivation through art and beauty
- Still thinking about maps? (Us, too.) The NASA Visualization team’s YouTube channel is filled with amazing gems like this.
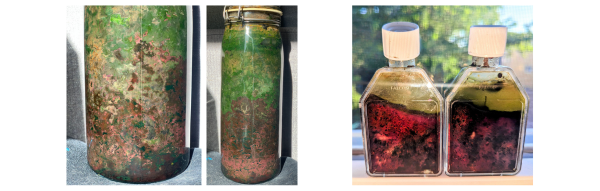
- This is your sign to make your own Winogradsky column — it’s an easy and beautiful way to visualize microbial diversity and biogeochemical cycling at home.
- Monica Cesinger started her Winogradsky column in 2020 with a few eggs, shredded paper, and mud from the University of Washington’s kayak launch: “I am so jazzed about the diversity of colors and microbes that have emerged as of today.”
- Shahar Bracha’s pair of columns are 33 days old, made with mud from the Mystic Lakes State Park in Medford, along with some eggshells and epsom salt (magnesium sulfate).
- Learn more: The Winogradsky column experiment (shared by Monica)
We believe in the power of our community, and our newsletter aims to showcase this. So many people are doing amazing work towards climate, sustainability, and planetary health. Thank you to everyone who submitted the ideas and inspirations which created this issue.
If you have any feedback, insight, or just want to say hello, please connect with us!
hello@homeworld.bio
@HomeworldBio